| [ Team LiB ] |
|
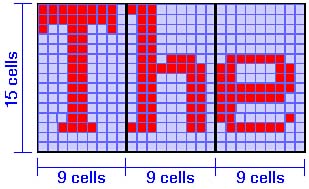
OutputAt the other end of the computer, its output, where it needs to communicate to you, the history is much the same as the input side. The first computers used hardcopy printed output to express their answers or displeasure. Even Charles Babbage envisioned printed paper as the basic output for his Analytical Engine. After all, paper has an enduring advantage. You can see your results for as long as you want, and more importantly, you can see your mistakes. When you can hold the evidence of your mistakes in your hand, you can repair your errors more quickly. But putting all output on paper has a big disadvantage. If you've ever waited for an important job to print, you know the frustration of watching each line slowly appear down the paper. Printing is a slow, mechanical process. Trying to run an interactive computing session while relying on your printer for output would be like running a relay race with a glacier anchoring your team. Much as the video data terminal changed computer input, it revolutionized computer output. Without it, interactive computing would be no more than a dream. But the computer terminal didn't appear on the market like Athena, fully armed and prepared for battle. It entered this world as a teletype machine that wrote with lighted phosphors instead of ink (and at the same speed). Over the years, the computer terminal picked up momentum, graphics, colors, and finally windows. At first, the personal computer simply split the video system from the keyboard and inserted the computer in the middle. Communications with the display followed the same routine as the terminal and the teletypethe slow, serial stream of text characters. In a quest for speed, engineers sidestepped their own best plans and revealed the magic of direct access and painting pictures directly on the screen. Today's systems add a second computer to your computer, one solely aimed at making images on your screen faster than you can blink. Teletype to TerminalWhen engineers ushered in Harvard Mark I in 1943, television was little more than a bluish dream in the minds of broadcasters, barely off to a flickery black-and-white start. The first commercial licenses went into effect in July, 1941, and then went on hold for the years of World War II. Putting text on the screen meant holding up a printed card. The only output devices available to the first computer were mechanical, and the one most readable by humans was printed paper, courtesy of the teletype machine. The early connection between computer and teletypes lingers on in the lingo. Even today, the data that's sent by a computer to its output device as a string of printable characters is still termed teletype output. The character string, if converted to the correct code, would run a mechanical teletype happily through reams of coarse paper. The first terminals were little more than teletypes that printed on the screen instead of onto paper. Essentially the same minimal design survives today at the dumb terminal, named not for the engineers who design it but for how it processes what you see. A dumb terminal is not smart enough to do data processing on its own. It puts each character on its screen exactly as it is received through the umbilical cable linking it to its computer host. Compared to the mechanical teletype, refinements are few. Instead of rattling off the edge of the paper, a too-long electronic line more likely will "wrap" or scroll down to the line below. The terminal never runs out of paperit seemingly has a fresh supply of blank screen below, rolling upward as necessary to receive each additional line. But the output it generates is even more tenuous than the flimsiest tissue and disappears at the top of the screen, perchance never to be seen again. In the electronic form of the computer terminal, the teletype method of text-handling means that when one character changes on the screen, a whole new screen full of text must be generated and sent to the terminal. The system cannot back up to change the one character, so it must rush headlong forward, reworking the whole display along the way. Add brains to a dumb terminal and you get a smart terminal. A microprocessor inside lets the smart terminal recognize special commands for formatting its display and may even be able to do some computer-like functions on its own. BIOS SupportComputers act like dumb terminals in their most basic display functions. They put characters on the screen like teletypes to produce teletype output under the guidance of their BIOSs. In fact, the basic computer BIOS gives several layers of teletype output. In the most primitive, a program must load one character at a time into a microprocessor register and issue a video interruptspecifically, interrupt 010(hex). The BIOS then takes over, instructing the microprocessor to check where to put the character (a several-step process in itself) and then pushing the character into the appropriate place in memory. The BIOS then returns control back to the program to process the next character. The most advanced teletype mode lets a program put an entire line of text on the screen through a similar, equally cumbersome process. In basic teletype mode, characters are written on the screen from left to right, from screen top to bottom, merely scrolling after each line is full or ended with a carriage return. More advanced display technologies are able to write anywhere on the monitor screen using formatting instructions much as smart terminals do. For example, commands in the computer BIOS let your programs locate each character anywhere on the screen. HTMLThe great advance made in communications by the Internet has at its heart teletype technology. Your computer displays basic Web text in teletype styleone character at a time as if it came as part of a string from a teletype. The chief difference between what came across the teletype wire and what comes through your Internet connection is the code. Teletypes used Baudot; the Web uses Hypertext Markup Language (HTML), layered upon the ordinary ASCII code that specifies individual letters. HTML uses the processing power of the computer to improve on basic teletype technology. Certainly it's quieter. Unlike a teletype machine, your screen does not chatter like the teeth of a freezing epileptic. More importantly, the HTML character stream includes formatting codes that allow it to specify type size and faces, even colors. Although your computer still pops each character on your screen in the order it appears in the HTML string, it can make changes in the appearance of each character based on the in-stream codes. The codes act as switches. When one appears in the data stream, it switches on a text featurefor example, turning the text red. All later text gets displayed in red until another HTML code turns it off or sets another color. Some HTML codes affect the formatting of characters displayed on your computer's screen (for example, indenting lines). This formatting is relative rather than absolute. Its effects vary depending on the size and shape of your Web display. For example, a simple tab might take up half a column on a narrow window or a few character widths in a wide one. In this way, HTML operates like a teletypethe characters in the HTML stream come out without regard to the size or shape of the display medium. More recent revisions to HTML allow the Web to go beyond minimally formatted text. Tables allow you to create more structure in your text displays. In addition, you can embed streams of images with your text characters. Even these elements, however, are handled like the letters and numbers relayed to an old teletype display. In other words, old ideas don't die. They just go online. Character TechnologiesThe most notable aspect of teletype technology, be it on your screen or on the Web, is that it is character oriented. The smallest unit of information it deals with is a text character. At the times when your computer steps back to this technology of yesteryearfor example, the first few moments of booting up, before it spins its disks to load the basic code of your operating system, or when you read your emailyour computer lets you see its world only in terms of letters and numbers. Somehow your computer must organize the characters it wants to display. Teletype machines handle this matter mechanically. They simply stamp each character on a piece of paper. The typing automatically organizes the text and the inky image preserves it. Your computer isn't so lucky. It has to organize the text in electronic form, it has to be able to move the character representations around inside its circuitry, and it has to keep the characters you see glowing on a screen that would rather remain permanently black. Your system has two alternative ways of dealing with the characters it wants to put on your screen. It can store and manipulate them in the form of individual characters, or it can break the characters down into tiny pieces called a bitmap, in which each piece representing one of the bright dots appearing on your computer display. Your computer uses both of these technologies every day. Although Windows treats your entire display screen as one giant bitmap, applications running under Windows often send information to the operating system to display in character form. Character-MappingWhen your computer deals with characters as a fixed unit, one code per indivisible character, it uses a technology termed character-mapping. The name refers to the character map, a special range of addresses that's sometimes called screen memory or display memory. The memory of the character map is reserved for storing the characters that will appear on the screen. Simple programs such as your computer's bootup BIOS routines write text on the screen by pushing bytes into the proper places in that memory. Just as a street on a roadmap corresponds to the location of a real street, each byte of display memory corresponds to a character position on the screen. The most common operating mode of the character-mapped display systems used by computers when they boot up divides the screen into a matrix (essentially a set of pigeonholes, with each hole corresponding to one position on the screen) that measures 80 characters wide and 25 high. To display a character on the screen, a program loads the corresponding code into the memory location associated with its matrix cell. To put the image on the screen, the display system reads the entire matrix, translates into a serial data stream that scans across the monitor screen, and moves the data to the video output. In other words, it creates the exact bit-pattern that will appear on the screen on the fly, computing each nanosecond of the video signal in real time. From there, the signal is the monitor's problem. For your programs, writing characters to the screen is simply a matter of writing directly to screen memory. Consequently, this display technique is often called direct writing. It is the fastest way to put information on a computer screen. Character-mapping is also more versatile than teletype technology. Programs can push characters into any screen location in any order they pleasetop, bottom, left, or right, even lobbing one letter atop another, overwriting the transitory existence of each. Once an advanced operating system such as Windows loads, however, your computer steps away from character-mapping. The operating system imposes itself between your programs and the BIOS. The operating system captures the characters your text-oriented programs attempt to fling directly at the screen. The operating system can then recompute the map, making it larger or smaller and, in the latter case, moving it to a designated area of the screen. Direct WritingThis quick way of putting characters on the screen is often termed direct writing, because programs simply move the code assigned to a character directly to the memory location corresponding to that character's screen positiona one-step process that requires only one microprocessor instruction. Direct writing makes a specific demand from programs using it: They need to know the exact location of each screen memory address. For all applications to work on all computers, the addresses used by each system must be the sameor your software needs some means of determining what addresses your computer uses. In the first personal computers, the design engineers reserved two memory areas to serve as character buffers, one for color text and one for monochrome. These memory areas became standard for all computers, and your system still uses them for the text it displays on the screen while it is booting up. To determine which character buffer to use, your software can check the video mode flag at a special location in memory, which indicates the proper buffer. Although this dual-buffer feature remains part of every personal computer, it's hardly necessary because of the universal use of color display systems. Character BoxesIn text modes, the display memory addresses hold codes that have nothing to do with the shapes appearing on the monitor screen except as a point of reference. The actual patterns of each character that appears on the screen are stored in a special ROM chip called the character ROM that's part of the video circuitry of the computer. The code value that defines the character is used by the video circuitry to look up the character pattern that matches it. The bit-pattern from the character ROM is scanned and sent to the screen to produce the final image. Modern display adapters allow you to download your own fonts (typefaces) into onboard RAM that's reserved from the same block that would serve as the character map. These downloaded fonts can be used as if they were located in ROM with the same ease of manipulation as ROM-based fonts. Downloaded fonts appear just the same, whether pushed on the screen through the teletype or direct-access technique. Each onscreen character is made from an array of dots, much like the text output of a teletype or dot-matrix printer. Computer and display adapter manufacturers use several video standards to build individual characters out of different size dot arrays. The framework in which the dots of an individual character are laid out, called the character box, is a matrix like a crossword puzzle. The character box is measured by the number of dots or cells composing its width and its height. For example, Figure 19.1 shows a series of characters formed in character boxes measuring 15 by 9 cells. Figure 19.1. Characters formed in 15-by-9-cell boxes.
The text modes used by various early display standards all had their own, distinctive character boxes. The standard Video Graphics Array (VGA) text screen uses a 16-by-9 character box. Each character takes up a space on the screen measuring 16 dots high and 9 dots wide. The last vestige of character mode display technology that remains under Windows is the DOS box, or command mode. You can select the height and width of the character box used in the command mode to adjust the size of the windows in which your character-based applications run in text mode using the properties sheet for command mode. The size of the character box does not exactly describe how large each character is or how many dots are used in forming it. To improve readability, individual characters do not necessarily take up the entire area that a character box affords. For instance, text characters on most monochrome displays keep one row of dots above and one below those used by each character to provide visible separation between two adjacent lines of text on the screen. Video AttributesThe character-mapped displays of most computer video systems do not store each letter adjacent to the next. Instead, each onscreen character position corresponds to every other byte in screen memory; the intervening bytes are used as attribute bytes. Even-numbered bytes store character information; odd bytes, attributes. The attribute byte determines the highlighting or color of a displayed character that's stored in the preceding memory byte. The codes used in monochrome and color displays are different. Monochrome characters are allowed the following attributes: normal, highlighted (brighter onscreen characters), underlined, and reverse-video characters (dark on light instead of the normal light on dark). The different attributes can be combined, although in the normal scheme of things highlighted reverse-video characters make the character background brighter instead of highlighting the character shape itself. These monochrome display attributes are listed in Table 19.1.
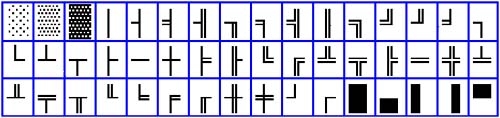
Color systems store two individual character hues in the attribute byte. The first half of the byte (the most significant bits of the digital code of the byte) code the color of the character itself. The latter half of the attribute (the least significant bits) code the background color. Because four bits are available for storing each of these colors, this system can encode 16 foreground and 16 background colors for each character (with black and white considered two of these colors). In normal operation, however, one bit of the back ground color code indicates a special character attributeblinking. This attribute allows any color combination to blink, but it also cuts the number of hues available for backgrounds in half (to eight colors, with all intensified color choices eliminated). When you or your software needs to be able to display all 16 background colors, a status bit allows the character-flashing feature to be defeated. Color display attributes are shown in Table 19.2. Because each character on the screen requires two bytes of storage, a full 80-character column by 25-character row of text (a total of 2000 characters) requires 4000 bytes of storage. In the basic computer monochrome video system, 16KB are allotted to store character information. The basic (and basically obsolete) color system reserves 64KB for this purpose. Video PagesThe additional memory does not go to waste, however. It can be used to store more than one screen of text at a time, with each separate screen called a video page. Either basic video system is designed to quickly switch between these video pages so that onscreen images can be changed almost instantly. Switching quickly allows a limited degree of animation. The technique is so useful that even today's most advanced 3D graphics boards use it, although with pictures instead of text. Two-Dimensional GraphicsThe only graphics available on the first computers were block graphics, akin in more than name to the first toys of toddlers, mere playthings that you wouldn't want to use for serious work. The first computer graphics systems made television look good, which in any other context would be an insurmountable challenge to the imagination. The foundation of the new display systemscalled bitmapped graphicsproved powerful enough that in a few years computer display quality not only equaled that of television, but computers were also used in making television images. The modern computer graphics system has taken a further step beyond and attempts to build a real (or real-looking) three-dimensional reality. The development of computer graphics is best described as accumulation rather than evolution. Each new system builds upon the older designs, retaining full backward compatibility. Even the latest 3D graphics systems retain the ability to work with the first rudimentary block graphics. Just as you share genes with some of the lowest forms of life, such as bacteria, planaria, and politicians, your sleek new computer comes complete with state-of-the-art 1981 graphics technology. Block GraphicsYou don't need a lot of computer power and an advanced operating system to put graphics on your screen, which is good because in the early years computers didn't have a lot of power or decent operating systems. In fact, even teletypes that are able only to smash numbers and letters on paper can print primitive graphic images. By proper selection of characters, standing far from printouts, and squinting, you could imagine you saw pictures in some printouts (a triangle of text might vaguely resemble a Christmas tree, for example). When computers operate like teletypes, their graphic output faces the same limitations as printoutscharacters can only approximate real-world images. To try to improve matters, the designers of the original computer took advantage of the extra potential of storing characters as byte values. Because one byte can encode 256 different characters, and the alphabet and other symbols total far short of that number, the first computer's designers assigned special characters to some of the higher-numbered bytes in its character set. Beyond dingbats and foreign language symbols, a few of the extra characters were reserved for drawing graphic images from discrete shapes and patterned blocks that partly or entirely fill in the character matrix. When your computer is operating in text mode, such as in command mode, you can still create rough graphic images by strategically locating these character blocks on the screen so that they form larger shapes. Other extra characters comprise a number of single and double lines as well as corners and intersections of them to draw borders around text areas. The characters are building blocks of the graphic images, and consequently this form of graphics is termed block graphics. Figure 19.2 shows the block graphic characters in the standard computer character set. Figure 19.2. Standard computer block graphic characters.
To a computer display system, block graphics are considered text and are handled exactly like ordinary text characters. All the text attributes are available to every character of block graphics, including all the available text colors, highlighting, and reverse video characteristics. The characters are also pushed onto the screen in text mode, which gives them high-speed potential, but they are available only in text mode or the Windows DOS box. Because they use the high-order ASCII charactersforeign territory for most seven-bit email systemsyou cannot ordinarily use them for images in ordinary email. Bitmapped GraphicsWindows marked the transition of the primary operating mode of computer display systems. From character-based displays, Windows ushered in the age of the bitmapped display. Bitmapped graphics improve the poor quality of block graphics by making the blocks smaller. The smaller the blocks making an image, the finer grain that can be shown, and therefore more detail. Physical aspects of the display system impose a distinct and unbreakable limit on how small each block can bethe size of the individual dots that make up the image on the video screen. The sharpest and highest-quality image that could be shown by any display system would individually control every dot or pixel on the screen. The most straightforward way of handling the information to be displayed on such a screen is to assign some part of memory to each pixel, just as two bytes are given over to each character of a character-mapped display. In the computer scheme of things, because the data controlling each pixel is stored as one or more memory bits, this kind of display system is often called bitmapped graphics. Alternately, because each pixel or point on the video screen can be separately addressed through memory, this method of controlling the video display is often called all points addressable graphics or an APA display. In the bitmapped graphics system, display memory stores an exact electronic representation of the onscreen image. It's actually a time-slice of what you seethe software running on your computer is constantly sending new data into display memory to update the screen image. The memory temporarily stores or buffers the changes' frame until they are read out as a complete image frame dozens of times per second. Because of this function, graphics display memory is often called the frame buffer. As with character-mapped memory, programmers have their choice of methods to write bitmapped graphics to your monitor screen. The BIOS can do it, but Windows substitutes its own drivers for the purpose. Programs can also write directly to memory, but modern video systems make that chancy because each display system uses its own memory locations, display modes, and resolutions. Video drivers bridge these differences. Bitmapped graphics hold the potential for being much sharper than block graphics. More pixels mean more detail. The number of dots on a screen and the ultimate number of pixels are many times the number of characters that are displayed on that same screen, from 64 to 126 times greater. However, bitmapped graphics imposes its own, interrelated penaltiesmemory usage and speed. The amount of memory required by a graphics display system depends on two factors: the sharpness of the display image and the number of colors (or gray levels) to be displayed. Each increase in sharpness and number of colors means that your computer is putting more detail (more information) on its screen and storing more information in its display buffer. As a result, it must move around more information (more bytes), which means more work. And the harder your computer works, the longer it takes to complete its job. Vector GraphicsBitmapped graphics are sometimes termed raster graphics because the technology organizes the screen into a series of lines called a raster that's continually scanned dozens of times a second. Although raster graphics are the basis of all computer displaysas well as today's television and video systemsthis is not the only way to put a computer image on a monitor. A completely different technique does not regularly scan the screen at all. Instead, it precisely controls the circuitry operating the horizontal and vertical deflection yokes. It doesn't trace scan lines but instead draws figures the same way you would as a series of strokes of a paintbrush. To keep the screen lit, it constantly retraces the figures. Because the signals controlling the monitor drive the electron beam in the CRT as a series of vectors, this image-making technique is usually termed vector graphics. Alternately, this kind of display system is sometimes called a stroker because of the kinship to drawing brushstrokes. Although not used on computers, the term pops up occasionally in the descriptions of expensive computerized workstations. ResolutionThe number that quantifies the possible sharpness of a video image is called resolution. It indicates how many individual pixels an image contains that your display system will spread across the width and height of the screen. Because your computer generates the image as an electrical signal completely independent from your computer monitor (it would make the same image even if your monitor wasn't connected to the computer at all), physical properties of the monitor (such as its physical dimensions) play no part in resolution measurements. In other words, the number of pixels in an image does not vary with the size of the screen that it is displayed upon. Resolution is expressed without reference to units of linear measurementresolution is described in pixels or dots rather than dots per inch. For example, the computer minimal resolution mode displaycalled VGA (for the circuitry of the first display system to use it, the Video Graphics Array)has a resolution of 640 pixels horizontally by 480 pixels vertically in its native graphics mode. Today's typical display has at least 1024 pixels horizontally and 768 pixels vertically. Dots per inch is a measure of actual onscreen sharpness, and it depends both on resolution and the size of the resulting image. At the same resolution, a larger screen has less sharpness than a smaller screenall else being equal. The higher the resolution of an image, the more pixels it will contain. The more pixels, the more memory needed to store them. Graphic AttributesHow much memory is required for a given resolution depends on a second factor in addition to the number of pixelsthe number of bits assigned to each pixel. At minimum, each pixel requires a single bit of storage. That bit can be used to code either of two conditionswhether the pixel is illuminated on the screen or invisibly dark. In the simplest bit-image graphics system, one bit of memory would then be used to map the condition of each pixel in the video display. What's lacking from this primitive mapping system is contrast and color. All bits are treated the same and their associated pixels look about the same, either on or off. The result is a single-hued picture with no variation or shading, essentially the same sort of an image as a line drawing. Although that may be sufficient for some purposes (for instance, the display of a chart or graph that mimics the monochrome look of ink on paper), color and contrast can add impact. The way to add color to bitmapped images is much the same as adding color to character-based displaysadding attribute information. Additional memory is devoted to storing the attribute of each bit. The bitmapped system works somewhat differently from the character-based mode, however. All the memory devoted to a pixel is used to describe it. No information needs to be devoted to identifying a character or pattern for each picture element because each one is essentially a featureless dot. Color PlanesA single bit per pixel results in what graphics folk call a two-color system, because it puts everything in black and whiteeach pixel is either on or off. Putting more color in the image requires encoding more informationmore bits and more memory. Adding a second bit per pixel doubles the number of possible displayable colors. (Shadesdegrees of darkness or lightare considered different colors in the terminology of computer graphics.) Every additional bit assigned to each pixel likewise doubles the number of possible colors. Hence, with n bits, 2n colors are possible. In computer graphics, the number of bits assigned to coding color information is sometimes described as the number of color planes. This term relates to the organization of display memory. The memory map of the graphic image can be visualized much like a Mercator projection of the world, with latitude and longitude lines corresponding to the different positions of the bits corresponding to pixels in the image. Additional bits per each pixel add a third dimension, much like layers of maps stacked atop one another, a series of flat planes containing the color information. With more colors used in an image, the better the apparent image-quality and the more life-like its appearance. For this reason, the temptation is to increase the bit-depth of each pixel as high as possible. However, the more colors or color planes, the more storage is needed for encoding each pixel. Moreover, much to the dismay of purveyors of video memory, the human eye is limited in its ability to resolve individual colorsmost people can distinguish only a few million distinct colors. Color monitors are even more limited in the number of colors they can display. Most monitors top out at about 262,144 colors, corresponding to the capabilities of an 18-bit display system. Once these limits are reached and enough memory is assigned each pixel, further "improvements" do not improve appearances. The practical limit on color is a bit-depth of 24 bits, which allows a system to store and theoretically display any of 16,777,216 hues. Display systems with this bit-depth are termed 24-bit color or True Color systems, because they can store sufficient information to encode more colors than anyone could possibly seethey hold a truly accurate representation of any color. Although some of the capabilities of True Color display systems are superfluous because they exceed the human ability to distinguish colors, True Color is a convenient system for designers because it assigns one byte of storage for each of the three additive primary colors (red, green, and blue) to each pixel. Before memory became cheap and processors raced beyond a gigahertz, this three-byte-per-pixel memory requirement was a burden on computer systems, straining both speed and storage. Some newer display systems have a 32-bit color mode. Instead of allocating the additional byte of storage to color information, however, most of these 32-bit systems put the extra bits to work as an alpha channel. The bits in the alpha channel hold control rather than color information. In effect, the alpha channel provides a storage place for special-effects information. The bits in the alpha channel normally are not tallied in counting color planes. The newest scanners may have 48-bit color capabilities. The extra bits are for colors you cannot see but could. When you want to adjust an image (for example, to brighten a dark scene), the extra bits ensure that even dark shadows have color differences. Brighten the image, and the shadows will have detail instead of being big, black blobs. The math for finding the amount of memory required to display a color graphics screen is straightforward. Simply multiply the number of pixels on the screenthat is, the resolutionby the bit-depth of each pixel. Then divide by eight to translate bits into bytes. For example, an XGA screen with 1024 by 768 pixels comprises exactly 786,432 pixels. If you want True Color (one byte of storage per color, or a total of 24-bits per pixel), you need 18,874,368 bits to store the image datathat's 2,359,296 bytes. A display adapter with only 2MB won't handle that combination of colors and resolution, but (rounding up to the next generally available increment) a board with 4MB will do nicely. Table 19.3 summarizes the memory required for common resolutions at various bit-depths for standard business graphics.
The values shown in this table refer only to two-dimensional display systems. The three-dimensional systems that are becoming popular gorge themselves on memory. Most have two frame buffers to take advantage of the double-buffering and use additional memory in rendering the imagefor example, to serve as a z-buffer. (Double-buffering and z-buffering are both discussed in the section later in this chapter titled "Three-Dimensional Graphics.") More memory is required for describing objects and even stuff you never see. Color CodingThe best and worst display systems assign the same number of bits to each of the three primary colorsa bit or an entire byte. For intermediary color depths, however, the base-2 digital nature of the computer and the three-fold nature of color vision come into direct collision. For example, if you want to assign a single byte to store the colors of each pixel, how can you evenly allocate eight bits among three colors? With two bytes per pixel, how do you divide 16 by 3 evenly? You don't. But you don't have to. You don't even have to code colors as a mix of red, green, and blue. Because the human eye is most sensitive to green and its shadings (probably something to do with primitive humans living in an environment lush with chlorophyll-green plants), some color-coding systems split their bit assignments evenly and assign the odd bit to green. For example, when the first computer engineers designed a 16-bit VGA color system, they assigned five bits to red and blue and gave six to green. Color SpacesIn mixing colors to produce a full spectrum, the number of hues any system can produce is limited by the range of its medium. Because most systems of colors involve three signals, such as the three primary colors of light, mapping them requires three dimensions, which in turn defines a volume or space. The range of colors that a specific system can handle is consequently called the color space. In the RGB system used by computer monitors, the range of red, green, and blue signals define the three dimensions of the color space, but the RGB system is only one possible color space. Other image systems encode colors in an entirely different manner. One of the most common is to encode colors by brightness (technically called luminance and abbreviated as Y) and two color (or chromaticity) values (abbreviated C1 and C2) that essentially correspond to coordinates on a map of colors. In more general form, the signals used are termed Y, Cr, and Cb. In effect, Y is the luminance or overall image brightness, derived by totaling together all three of the RGB signals. Cr represents the difference between the red and luminance signal. Cb represents the difference between the blue and the luminance signal. Subtract Cr from Y and you get the red signal. Subtract Cb from Y and you get blue. Subtract both the resulting red and blue signals from Y and you get green. A related system used by composite video signals transforms the YCrCb signals into intensity, hue, and saturation. In the intensity/hue/saturation color space, intensity describes one axis of the color space. Saturation is defined as the distance from the intensity axis, and hue is the direction from the axis. Together these three measurestwo distances and an angledefine the three dimensions of the space. In effect, hue is represented as an angle in the phase relationship between two signals. In conventional video signals, as used by televisions, VCRs, and other video equipment, the intensity information is called the luminance signal, and it takes the form of a standard black-and-white television signal. The saturation information is represented as the corresponding amplitude of an added signal called the color burst. The phase relationship between the luminance signal and the color burst defines the hue. In this way, the three dimensions of the video color space are cleverly encoded in two signals. Commercial printers use a different color scheme to start, the so-called process colors of cyan, magenta, yellow, and black (often abbreviated as CMYK). These colors correspond to the ink colors used in the four-color printing process. The black adds depth to the printed colors. These different color spaces and coding methods are useful to particular output devicesCMYK colors for storing images that eventually will be printed and published; luminance and chrominance coding for images that will eventually be used in broadcast-style (as opposed to computer) video systems. To be displayed by normal computer monitors, they must be translated from their native format to the RBG signals used by computer monitors. Color-MappingAnother method of encoding colors in memory that requires translation has found greater use in computers, particularly when a manufacturer wants to scrimp on video memory. A technique called color-mapping stores only code numbers for colors, allowing each code number to stand for almost any color. One code number gets stored in video memory for each onscreen pixel. The display system matches the stored numeric code values to a Color Look-Up Table (CLUT) that tells which color corresponds to each number; then that color is sent along to the monitor. Because of the nature of colors in the real world, color-mapping can lead to substantial economies in display memory. When the values stored in screen memory directly indicate what color appears on the screen, as they do in the preceding example, the colors are said to be direct mapped. Direct mapping allows any pixel to be any color, but most images are made from far fewer colors. By mapping the colors, you can trim the amount of memory used to store an image. Although memory is not so much an issue with computers as it used to be, file size remains a consideration when shipping images across the Internet. Consequently, most images use some kind of mapping when they are stored. Most image-compression schemes use some form of color-mapping. The GIF (which stands for Graphic Interchange Format) files widely used on the Web are color-mapped to use only eight bits of storage for each pixel. Graphic CommandsThe secret weapon of achieving high speed in any graphics system is the high-level graphic command. By combining all the tiny steps of complex screen operations into a single routine, some of the most intricate onscreen images can be encoded as a few commands. Not only do high-level graphic commands make programs more compact, they allow your computer's microprocessor to offload the work of building images in the frame buffer. Your microprocessor uses the high-level graphic commands to send instructions to a graphics subsystem. In today's computers, that means a graphics accelerator chip or a 3D accelerator. The accelerator executes the commands to move pixels around in the frame buffer. The range of these graphic commands is large. Each accelerator chip has it own repertory of them. The most common among them are detailed in the following subsections. Bit-Block TransfersBit-block transfers are instructions that tell the graphics chip to move data from one place to another in display memory. Instead of moving each byte of screen data through memory, the microprocessor only needs to tell the graphics chip what block to move (the source of the data) and where to put it (the destination). The graphics chip then carries out the entire data-transfer operation on its own. Often shortened to BitBlt, bit-block transfers are most commonly used for scrolling an image up the screen. You can easily see the effect the command makes in video performance. When you scroll a bit-image up the screen using a graphics chip, the top part of the image often snaps into its new position, leaving a black band at the bottom of the screen that slowly fills with the remainder of the image. The initial quick move of the top of the image is made entirely in display memory using BitBlts. The rest of the image must be brought into display memory through the I/O bus or local bus, thus resulting in delays. Drawing CommandsDrawing commands tell the graphics chip how to construct part of an image on the screendrawing a line, rectangle, or arc, or filling a closed figure with a solid color or pattern. Often called graphic primitives, these commands break the image into its constituent parts that can be coded digitally to build a shape on the screen. Before your computer's microprocessor puts a line on the screen, it first has to compute where each bit of the line will appear. It must compute the coordinates of each pixel to appear on the screen and then transfer the change into display memory across the bus. With a graphics chip, the microprocessor only needs to indicate the starting and ending points of a line to the chip. The graphics chip then computes the pixels and puts the appropriate values in display memory. SpritesSprites are small images that move around the screen as a unit, much like an onscreen mouse pointer. General-purpose microprocessors have no provisions for handling sprites, so they must compute each bit of the sprite image anew every time the sprite moves across the screen. Many graphic chips have built-in capabilities to handle sprites. They store the bit-pattern of the sprite in memory and only need instructions telling them where to locate the sprite on the screen. Instead of redrawing the sprite, the graphics chip need only change the coordinates assigned its onscreen image, essentially only remapping its location. WindowingWindowing is one of the most common features of today's graphic operating systems. Each task is given an area of the screen dedicated to its own operations and images. Keeping straight all the windows used by every task is a challenge for a general-purpose microprocessor. Graphics chips and 3D accelerator chips, however, are usually designed to manage windows using simple commands. Once an onscreen window is defined, it can be manipulated as a single block rather than moving individual bytes around. The windowing operations can be strictly software manipulations, or the graphics chip may include special hardware provisions for streamlining the control of the windows. In a conventional windowing system, software controls the display of each window. The layout of the screen is calculated, and the proper values for each pixel are plugged into the appropriate locations in the memory map. The image is generated by reading each memory location in sequence and using the information it contains to control the intensity of the electron beam in the display as it sweeps down the screen. Every memory location is scanned sequentially in a rigid order. Hardware windowing works by slicing up the frame buffer. Although each dot on the screen has one or more bits of memory assigned to it, the map no longer needs to be an exact coordinate-for-coordinate representation of the screen. The video chip no longer scans each memory location in exact sequential order as the video beam traces down the screen. Instead, the memory scanned to control the beam is indicated by pointers, which guide the scan between different memory areas. Each memory area pointed to represents an onscreen window. Each window can be individually manipulated. The memory used by a window can even be mapped into the address range of the system microprocessor while the rest of the screen is handled separately. As a consequence, most of the calculating normally required to change a window is eliminated. Therefore, screen updates speed up substantially. PanningHardware panning takes advantage of the some of the memory in the video system that's not needed as a frame buffer. For example, your video board may have 2MB of memory but uses only 1.5MB to store a full 1024-by-768-pixel image with 16-bit color. The extra half megabyte of memory can hold an image that's bigger than that displayed on the monitor screenthe monitor image essentially becomes a window into display memory. Instead of stretching out for 1024-by-768 pixels, for example, the extra display memory might allow the filling of an 1152-by-864-pixel map. To pan the onscreen image one way or another on the screen, the display circuits only need to change the address of the area routed through the output of the board. Changing addresses is much faster than moving blocks of bytes with BitBlt instructions, so hardware panning takes place very quicklyas long as the video board's memory holds the entirety of the image to be displayed. This technique is most useful when you have an older monitor that's not quite up to today's high scan ratesyou put as much image on your screen as your monitor can tolerate while organizing your work across a larger desktop. Depending on the hardware and drivers you've installed in your computer, Windows allows you to adjust the size of your desktop and onscreen display independently through the Settings tab of Display Properties. Three-Dimensional GraphicsAll the latest display adapters claim to have the capacity to display three-dimensional images. In other words, they claim to be 3D boards. In terms of a display adapter, 3D means more and less than it seems. 3D does not mean what it did in the 1950s when your parents or grandparents put on blue-and-red glasses with cardboard frames to watch The Creature from the Black Lagoon jump out of the movie screen at them. In computer terms, that kind of 3D is a stereoscopic display. In computer terms, 3D means adding simulated depth to the flat images on a monitor screen. But a 3D graphics adapter does more than add the appearance of a third dimension. It also gives 3D motion to your images to add excitement to games and give attention-grabbing effects to your presentations. Indeed, the motion part of the 3D board's job is its toughest assignment. Not only must it make 3D images, but it also has to make them fast enough (at least 15 frames per second) that you think they are moving rather than just flashing at you. Generating those images takes more processing power than was available in a computer a few years ago. The 3D boards have to move megabytes, even hundreds of them, every second. They have to cope with mathematical functions you probably never knew existed in high schooland frightened you into an Arts degree once in college. Yet they now encapsulate all the power they need in today's graphics accelerators. Better still, most of the math is gone. When developers write programs, they only need to call the advanced functions built in to programming interfaces such as Microsoft's DirectX. No matter what you use your 3D board for, it needs to handle a few basic functions to generate its illusion of 3D reality. These functions can take place in hardware or softwarethat is, your graphics accelerator can take care of the heavy-duty computing itself or rely on your computer's microprocessor to do the hardware and merely pass along conventional two-dimensional functions to your 3D board. Obviously, a 3D board is supposed to do all the 3D work itself, but DirectX will take over if your board doesn't have the hardware functions it needs. TessellationComputers face a problem in creating and manipulating three-dimensional objects. Because a computer works only with numbers, objects must be mathematically described for the computer to have any idea of how to deal with them. Finding a set of equations to describe a complex object is a daunting taskso daunting that programmers don't dare face it. Instead, they break complex objects into easily describable pieces and use the computer to manipulate those pieces. What they do is make their images the same way a mosaic artist makes a picture from small tiles. The process of breaking the image into tile-like pieces is termed tessellation. The term comes from the name given to one of the mosaic artist's tiles, tessera (the plural form is tesserae). In 3D graphics, the computer manipulates each tessera individually. When its transformation is complete, the computer recombines all the tesserae to create the original object. To eliminate the seams between the individual tessera and other artifacts of the manipulation, the graphics system filters the resulting image combination. In practical 3D display systems, the tesserae are polygons, usually triangles. The performance of 3D processors is often expressed in the number of polygons (or triangles) that can be rendered in a second. The number has to be prodigious. A complex object may require 20,000 or more polygons. Rotate it with 15 updates per second, and your graphic chip has to render 300,000 polygons per second. The polygons per second description of a product really doesn't reveal a lot. The rendering time for any polygon depends on its shading, texture, and other attributes. Chipmakers rate their products with their theoretical capabilities, and you can guess whether they would use best-case (monochrome, smooth surface triangles) or worst-case (True Color, polygons with complex textures, filtering, and antialiasing) conditions. Texture-MappingAt this level, the individual tesserae of the image would have the appearance of armor plates or a stealth fighter. Each one would be a single, solid, unrelieved color. Outside of jousts and midnight bombings, reality rarely looks so armor plated. Real objects have shading and texture that makes them look, well, realistic. To add realism to the 3D objects your computer generates, the graphics system adds texture. Through a process called texture-mapping, a two-dimensional texture is applied to the surface of each tessera, making up the image. In effect, the texture is glued to each surface of the image. In the texture-mapping process, the computer starts out with an image of the texture. The complete texture is broken into small constituent parts, similar to the pixels in a video image. Each of these pieces is termed a texel. The computer manipulates the texture by rotating and scaling it and applying perspective techniques to make it correspond to the manipulations performed on the tessera to which it is applied. The computer then maps the texels to pixels. Because of the manipulations of the tesserae and texture, one pixel does not always correspond to one texel. Typically, the position of a given pixel appears between texels. Simply applying the color of the closest texel to the pixel results in an unrealistic image. The image may get blocky as multiple pixels take on the same color, or it may shimmer with slight movements as pixel values shift dramatically between texel values. To prevent these effects, the graphics system may apply bilinear filtering during the texture-mapping process. The pixel color takes on a value intermediate between the colors of the four adjacent texels. The result is a more realistic appearance of the texture color, particularly as the image is moved or rotated. Most 3D systems store their textures in several different levels of detail for situations requiring different 3D depths and resolutions. Typically, each level is designed for half the resolution of the preceding one, so a collection would include textures at resolutions of 100, 50, 25, and 12.5 percent. Each texture level is prefiltered and tuned to best appearance at its resolution level. Taken together, the stored collection of a single texture at various levels of detail is termed a mipmap. Objects can appear at any depth in the image, but the mipmap stores only discrete levels of detail. At some depths the texture applied to a polygon will require a level of detail between those in the mipmap. The 3D processor interpolates an intermediate texture using a technique termed trilinear filtering. The processor first performs bilevel interpolation (bilevel filtering) and a further linear interpolation between the detail levels applicable on either side of the polygon's depth. Texture-mapping is one of the most complex of the operations required in three-dimensional graphics systems. Making the necessary calculations for mapping and filtering may take up half or more of the processing time for the image. Consequently, texture-mapping benefits greatly from hardware acceleration. Depth EffectsWhat separates ordinary graphics displays from 3D displays is the appearance of depth to the image. In a 3D image, some objects appear closer than others. The difference in depth is, of course, an illusion because the face of the picture tube or LCD remains flat. The 3D display system must fool the eye into believing it perceives depth. The problem is not new to 3D display systems. Ever since the first cavemen scratched walls with charcoal and ochre, artists have attempted to add depth to their paintings and drawings. Over the years they discovered (and often rediscovered) the techniques of perspective and other means that take advantage on the depth cues the human eye uses to put distant objects in their places. RecessionOne of the primary depth cues to the human eye is image size. The smaller an object of a known size appears to be, the farther away it seems. Three-dimensional graphics systems use a technique termed perspective divide to simulate this effect. To make a distant object smaller, the graphics system scales distances in the x and y coordinates of the image by a factor that is proportional to the z coordinate. In simplest form, distances in the x/y coordinate system are divided by the z valuethe larger the z value, the smaller the object becomes. The effect is the same as one-point perspective in the art world. Parallel lines, such as railroad tracks, converge at a single point in the distanceas z approaches infinity, the values of x and y approach zero and the coordinates collapse into a point. Atmospheric PerspectiveArtists have long used the technique of atmospheric perspective to add depth to paintings. Because of the effects of looking through a long reach of atmosphere, which isn't perfectly clear because of the haze of dust and water vapor suspended in it, distant objects appear paler and bluer than nearer objects. Artists capitalize on this visual effect and mix white and a trace of blue with the color of objects that are supposed to appear in the distance in their paintings. The corresponding technique in three-dimensional computer graphics is termed fogging. To make an object appear more distant, the graphic system adds a fixed color called the fog color to the hue of the object. The amount of fog color added in increases with the apparent distance of the object. Because the fogging technique corresponds to the appearance of natural haze, the technique is sometime called by that name, haze. This technique is also called depth cueing. Lighting EffectsPhotographers and artists quickly learn that lighting is the key to making their two-dimensional images appear to represent three dimensions. The pattern and depth of bright areas and shadows allow the human eye to determine depth and the relative locations of objects. When an object sits between another object and the light source, the first object is brightly lit and the second object is in shadow. The technique of rendering images using the effects of light and shadow is called chiaroscuro, from the Italian for "clear-dark." Chiaroscuro rendering is one of the great challenges facing the 3D graphics system. Ray-TracingThe most powerful and compelling way to render the lighting of a three-dimensional scene uses the technique of ray-tracing. The computer follows, or traces, the path of every light ray that impinges on the scene. The process is complex. The computer determines which object each ray strikes based on the direction of the origin of the ray. After the ray strikes the object, the computer determines how much of the ray illuminates the object and is reflected. Based on the angle of the object surface to the light beam, the computer determines a new path for the reduced beam and plots it to the next object, continuing until the beam is so diminished it has no further effect. Once all the rays have been traced, the computer sums up the amount of light that has struck each surface. Those surfaces with the most rays are the brightest; those with few rays are in shadow. Of course, to make the math tractable, the computer deals with only a reduced set of rays (the more, the better the rendering). The math is so complex that computers cannot perform ray-tracing on reasonably sized images in real time. The technique works extremely well for static images (if you're patient) but requires each frame of an animation to be individually rendered, taking perhaps a minute per frame. The ray-tracing technique consequently is not suitable to generating compelling 3D animations in real time. ShadingComputer graphics systems use a simplified means of creating the chiaroscuro effect called shading. In the simplest form, the computer determines the angle of a surface to the light source and, using the reflectivity of the surface, computes how bright the surface should be rendered. Gouraud shading, also known as smooth shading, takes an additional step. It interpolates lighting values across the face of a surface to give gradual color transitions from a bright edge to a dim edge. Z-BufferingOne way to eliminate the display of hidden surfaces is to track the depth of picture elements. The depthor the distance away from you the element is supposed to appearis assigned a value. This value corresponds to the position of the element on the z-axis of the three-dimensional coordinate system. In the z-buffering technique, this depth value gets stored in a special z-buffer. As the graphic chip updates the image, it compares the z value of each pixel to that stored in the z-buffer. When the z value in the buffer is less than that of the newly rendered pixel, the old value is nearer and would obscure the new value, so the new value is discarded. If the new value is lower and would thus appear in front of the old value, the old value gets discarded, replaced by the new value. TransparencyObjects in the real world are not always opaque; otherwise, seeing through the windshield of your car would be a much greater challenge. To account for the effects of a transparent object sitting in front of another object, many 3D imaging systems store a transparency attribute for colors in addition to the normal red, green, and blue values. The storage for this additional attribute data is termed the alpha channel. Commonly the alpha channel is an extra eight bits added to the 24 bits used to store True Color pixel data, resulting in a 32-bit storage system (or four bytes per pixel). Most systems assign higher values to greater opacity, so 255 would be totally opaque and 0 totally transparent. When calculating the appearance of a given pixel, the graphics processor uses the alpha channel values to determine its resulting color through a process termed alpha-blending. The processor adds an fraction of the color of the transparent object set by the alpha channel value to the color of the background object. Mixing the colors together gives the appearance that the background color is seen through a layer of the transparent object. By itself, of course, alpha-blending only changes the color of pixels. You need more to give the true illusion of transparency. The viewer's eye also takes cues from the shape of the transparent object (defined by the color change made by the alpha-blending) as well as the difference between the background color seen with and without the transparent mask. The programmer must take all of these factors into account to produce a compelling three-dimensional image. Double-BufferingTo create smooth animation, 3D display adapters use the technique of double-buffering. As the name implies, this technology puts two frame buffers in control of the graphics chip. The front buffer corresponds to the traditional display buffer, connected to the rasterization circuitry that reads it sequentially and sends the video data to the screen. While the front buffer is scanned, the graphics chip draws in the back buffer, where the rendering operation is hidden and access is not limited by the timing of the rasterization process. Once the graphics chip completes its drawing, the two buffers are switchedthe back buffer becomes the front buffer and the image drawn in it gets sent to the display. The graphics chip can then begin drawing in the new back buffer. By cycling between the two buffers, double-buffering allows a fast but limited form of animation. It also achieves the same end as double-ported video RAM without using expensive, specialized memory chips. At the same time, it eliminates the appearance of the drawing process on the screen. Image CreationThe various hardware technologies are only tools used by your computer's display system in creating a bitmap of the screen image. Your softwarethat is, your computer gamefirst must generate the scene that will be displayed and make a new one as often as 30 times each second. Generating the 3D images used in today's games is the most computationally intense task your computer faces. In fact, the work involved in creating and updating all the information in a 3D graphic scene in real time is beyond the capabilities of even today's most powerful microprocessors and display systems. That's not to say the images you see on your screen today are impossibleit's just that they are not all they seem to be. Of the many lessons the designers of 3D graphics have learned from Hollywood, the art of building sets is probably the most important. Watch any movie epic, and you'll see lavish scenes of grand structures, huge crowds, and endless panoramas, none of which ever really existed. The panoramas may be painted, projected, or matted into the scene. The crowds are photographed to make a few people seem like a mass, or the same supernumeraries are shot two or four times in every scene. And the huge sets and extravagant buildings are mere facades, a pretty face with nothing behind but bare two-by-fours propping everything up. The important lesson is that only what shows counts. That's the secret that makes today's 3D graphics look as good as they do. When confronted with an overwhelming calculating chore, your graphics hardware does exactly what any high-school student would do in the situation. It ignores most of it. But far from blaming what it doesn't do on the errant ways of the family canine, it takes the approach of the Hollywood set builder. It assesses exactly what will show in the final image and concentrates its work on that. As far as the behind-the-scenes stuff goes, the software only does what's necessary so that the whole set doesn't collapse around the stars. In other words, writing good 3D graphics software is the art of knowing what not to do. Engineers call this strategy culling, which means picking the best or most important. SpacesUnlike two-dimensional display software, which creates each scene exactly as you see it on the screen, a 3D display system images a scene as objects. An object is anything that can be manipulatedmoved, rotated, stretched, or squashedas a single entity. The software describes each object numerically and transforms it from frame to frame using mathematics. Each object defines its own model space with its own coordinate system for these manipulations. The objects are mapped into the coordinate system of the world in which they act, corresponding to the Hollywood sound stage or location set. All objects in this world space use the same coordinate system that defines exactly where they appear in the scene. Once the software has put all the objects into place, it can generate a camera's-eye view of the scene, like dropping the tripod legs of a Panavision camera to film the scene. The camera sees the scene from its own coordinates, creating what engineers call the camera space or view space. At this point, the software can trace the path of light rays from the camera to distant parts of the scene. This view lets the software begin cheating. When a ray hits a solid (as opposed to transparent) object, it can go no further. The software knows that it can ignore anything from that point on, so it does not have to calculate other objects or background textures that lie beyond that point. This view space is actually encompassing a solid volume, a pyramid with the camera at its apex, called the view frustum. The software transforms this view into clip space by distorting the frustum into a cube. That is, it mathematically spreads out the pyramid. This process distorts the objects in the scene, making those closer to the camera larger, which makes the more distant objects appear smaller. This transformation yields perspective and a distance effect. Finally, the software squashes the clip space cube into a two-dimensional view of the scene that corresponds to what you would see on your video display, the screen space. The object descriptions that survive culling and have been transformed into screen space get loaded into the frame buffer and passed along to your computer display for your viewing. 3D PipelineMost 3D display systems process scenes in a 3D pipeline, much as a microprocessor executes programs. The pipeline allows the 3D accelerator to work on several steps of display processing at the same time to speed up its operation. It starts out in software, typically the game you are playing. The software defines the objects and whatever transformations they require from one frame to the next. The software describes an object as a set of points representing the vertices of triangles (triangles, because the three points making up the vertices uniquely describe a plane surface). At this point, the object is nothing more than a few points describing a wireframe made up of triangles. Even so, the software can start the culling process, identifying the triangles on the back of the object, those that won't appear in the final view. The software can put the objects at this stage into their world space and construct a view space, again culling the areas that will be in view. It will also define the lighting of the scene and where shadows will fall. At this point, the software is ready to develop the screen space. It now fills in the rectangles with the proper shades and textures. To add aerial perspective, it may also add fog to distant objects. It may also smooth out jagged outlines. The software then moves the rendered image into the frame buffer (alternately, it may render the image directly in the frame buffer). At that point, the image need only be rasterized by the video controller and sent on its way to the monitor and then to your eyes. |
| [ Team LiB ] |
|