|
|
|
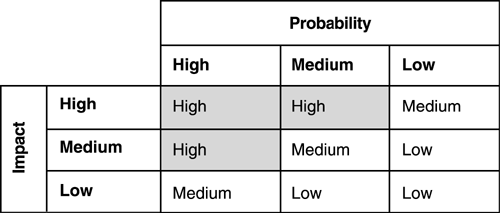
10.7 Incorporating Probability into Risk MitigationChapter 9 presented the concept of probability and showed how it could be incorporated into process 7 of OCTAVE. The chapter then focused on the problems of estimating probability in the absence of extensive data on threats. This section revisits the concept of probability, but this time focusing on using it when making risk mitigation decisions. Specifically, it addresses issues relating to expected value. Setting Priorities Using Expected ValueThe expected value (or expected loss) for a risk is the product of the potential loss that could occur (or impact value) multiplied by its projected frequency of occurrence (or probability). The expected value is often measured in annualized loss expectancy (ALE), that is, the monetary loss that can be expected in a year [Hutt 95]. Many common risk analysis approaches use expected value (also referred to as risk exposure) to set priorities. Higher expected values in a given year correspond to a higher-priority risk. In addition, conventional wisdom dictates that funds dedicated to mitigation activities in a year should not exceed the expected ALE. Using expected value to set priorities is a straightforward way of setting priorities. However, there is one major problem with this approach. Extreme and catastrophic events have low probabilities and a very high impact on the organization. An analysis based solely on expected value equates catastrophic events with those that have a high probability but very low consequences [Haimes 98]. Thus, decision makers relying only on expected values when making decisions would put the same effort into mitigating a high-probability, low-impact event as a low-probability, high-impact (i.e., catastrophic) event. Assigning Expected ValuesLet's take a look at how you would assign expected values to risks. First, let's consider how to determine the expected value in a quantitative analysis. Since expected value is the product of a particular risk's impact value and probability, you simply multiply those two numbers to calculate the expected value for that risk. Now, how would you determine the expected value in a qualitative analysis? Remember, we do not use numbers in a qualitative analysis; rather, we assign "high," "medium," and "low" values to the impact and probability of each risk. To look at the combination of impact and probability, use a table like the one in Figure 10-10 [Dorofee 96]. Figure 10-10. Expected Value Matrix
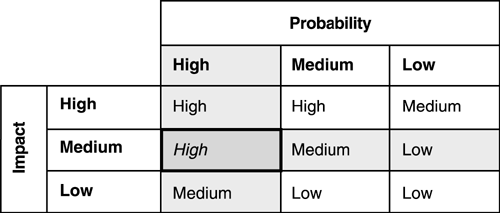
For example, for a risk that has an impact value of "medium" and a probability of "high," the expected value would be "high." The expected value for the risk lies in the table cell where the individual probability and impact values for that risk intersect. See Figure 10-11 for a graphic representation of this example. Figure 10-11. Expected Value Example
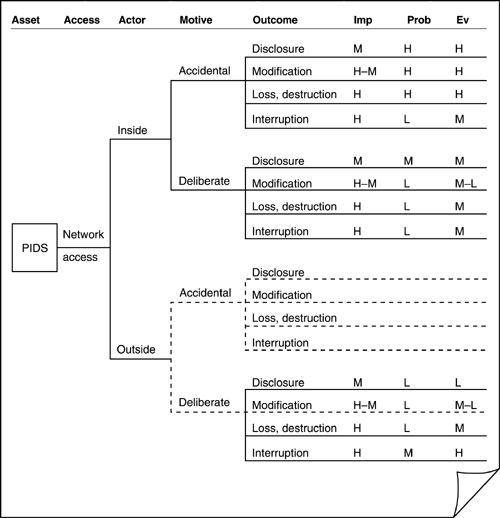
Tending Toward MediumLet's take a look at expected value in the context of our running example (see Figure 9-6). Chapter 9 showed how the analysis team could have estimated probability using the risks to PIDS resulting from human actors using network access. Figure 10-12 presents the expected values for those risks determined using the matrix in Figure 10-10. Figure 10-12. Expected Values (EV) for Part of PIDS Risk Profile: Human Actors Using Network Access Tree
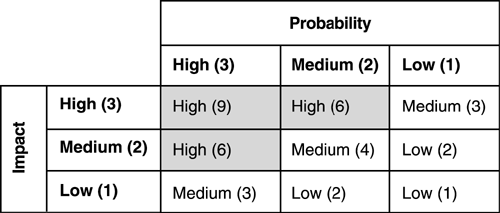
Notice as you look across the risks in the tree that there is a tendency toward "medium." Also note that any potential catastrophic event that has a "low" probability and "high" impact would be assigned a "medium" expected value. A high-probability, low-impact risk would also be assigned a "medium" expected value. But would you mitigate these two risks in the same way? The first risk might put you out of business, whereas the second might merely be a nuisance. Using expected values alone obscures the significant differences between these two cases. Expected value in a qualitative risk analysis approach does separate the extremes and can be used to help guide decisions. However, you must not depend upon it completely, for the reasons mentioned above. Assigning Numerical Values to Qualitative DataAs we finish our discussion about expected value, we want to warn you about a common mistake that we see in many risk analysis methods. These methods express "high," "medium," and "low" as numerical values. For example, a method might assign high a value of 3, medium a value of 2, and low a value of 1. To determine expected value, the numbers are multiplied (as in a quantitative analysis). Figure 10-13 shows the resulting matrix. Figure 10-13. Expected Value Matrix with Numerical Values
We caution you not to follow this qualitative approach, which does nothing more than indicate relative priority. If you assign numbers to those values and then perform mathematical operations on the numbers, you are implying a quantitative relationship that you have not established. For example, it might be tempting to say that a high-impact, medium-probability risk has twice the expected value of a high-impact, low-probability risk, because their respective expected values using the numerical values in Figure 10-13 are 6 and 3. However, because we have looked only at relative ranking of impact and probability, we can merely conclude that we consider the first risk greater than the second. We cannot begin to say how much greater. So beware of assigning too much meaning to relative rankings. We have seen some risk analyses that assign numerical values to relative rankings and then put those numbers in a "proprietary algorithm." The results can be meaningless and dangerous if people base their decisions solely on the resulting numbers. UncertaintyFinally, we offer one last caution about using expected values. Consider a quantitative risk analysis approach where impact values and probabilities are quantitatively estimated. In this case, expected values can be calculated using multiplication. Many approaches that incorporate quantitative estimates of impact and probability leave out one major concept, namely, the uncertainty associated with each numerical value. When you quantitatively estimate impact and probability, each estimate will have an uncertainty associated with it. The uncertainty depends on the data that you have gathered and the statistical approach that you use to estimate each value. The resulting expected value has an uncertainty that is a combination of the individual uncertainties of impact and probability. Many risk analysis approaches produce a number as the expected value but give no indication of the confidence level (or uncertainty range) associated with it. As a result, less sophisticated decision makers will have a false sense of security in the quantitative expected value produced by the tool. Therefore, you must also beware of assigning too much meaning to quantitative results of a risk analysis. Know how the values were estimated and calculate the resulting uncertainty associated with each number. Thoughts About How to Use ProbabilityOur overall message is simple: be careful how you incorporate probability into your decision-making process. People who have less experience with risk evaluations will most likely have greater confidence in their estimates of impact than in their estimates of probability. Thus, you might want to use impact as the primary driver when you decide whether to mitigate or accept a risk. You could use probability to help determine which mitigation plans to implement first. For example, you might use scarce resources to address a medium-impact, high-probability risk in the near term. Later on, you might be able to free up enough resources to address a medium-impact, medium-probability risk. In this case you are using probability to refine your priorities by determining when to implement mitigation plans. You are not using probability to drive the decision of whether to accept or mitigate the risk. Unfortunately, we cannot offer a silver bullet or a step-by-step process that applies in all circumstances. No matter which risk analysis method you decide to use, you need to understand the limitations of any information that you gather. Risk analysis methods support your decision making and help you to make reasonable decisions about information security; they do not replace your need to think. Just remember that you always have to use your best judgment when making decisions in any risk analysis approach. Chapter 11 presents the final workshop of the OCTAVE Method, in which you take the results of the evaluation and present them to your organization's senior managers. |
|
|
|